Port innovation from the bottom: the hydrographic (re)evolution

The most cutting-edge hydrographic services of the main international ports have technologies that generate bathymetric models obtained from the measurement of sea depths to determine the topography of the what lies on the bottom of a port.
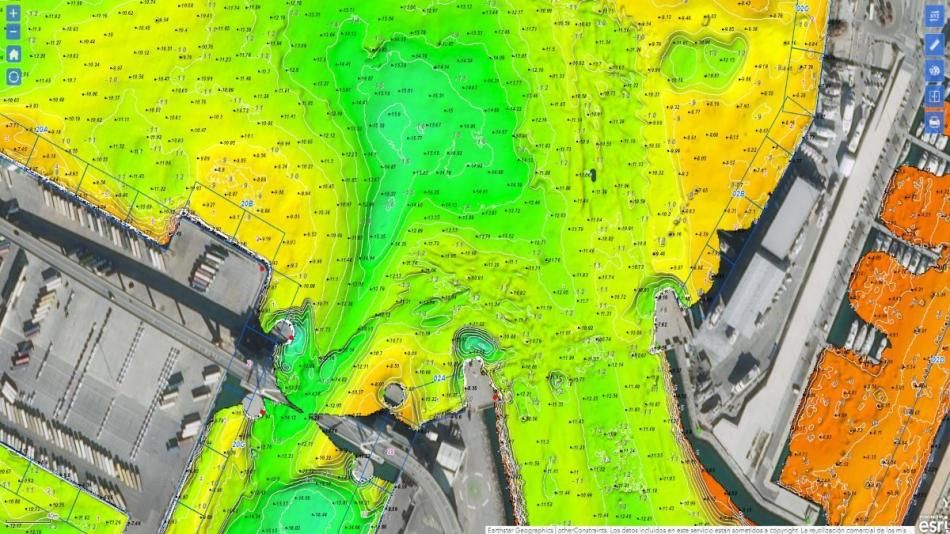
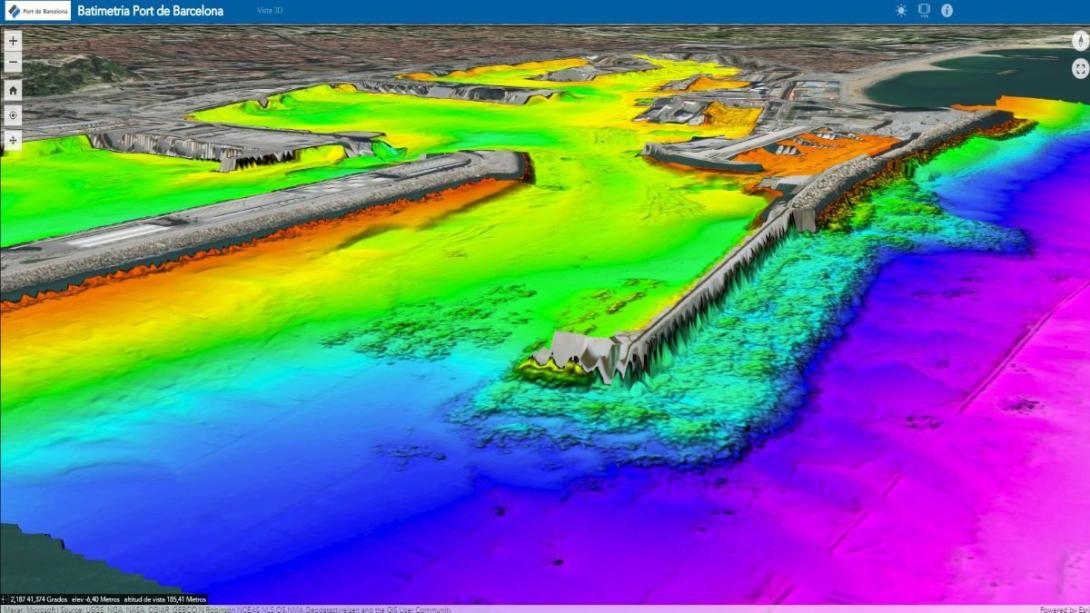
The most advanced systems consist of multibeam measurement that sends out hundreds of acoustic beams in a single signal that allows the hydrographer to receive more than 400 points that are measured up to ten times per second, a level of detail that is reflected in cartographic models of high resolution that describe the port seabed. This information is essential for infrastructure security, port operations and for the vessels that navigate its waters.
The way to process and visualize this information collected by multibeam systems has also evolved. Nowadays, softwares allows intelligent management and screening of the thousands of bathymetric data collected during inspection campaigns and to share them with different departments in an understandable and adjusted digital format suited to the user’s needs.
Collecting the information
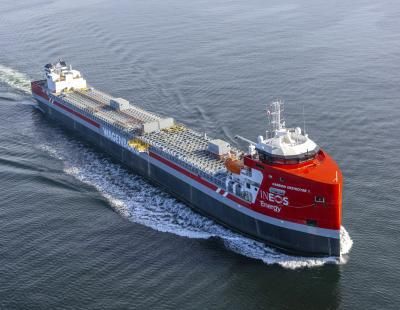
Ports like Barcelona carry out bathymetric surveys from a boat that incorporates a multibeam measurement system. To measure depth, parameters such as position must be controlled by means of GPS antennas linked to a reference station, located in the case of Barcelona in the Control Tower. Another key point is the relative position of the boat in the water, controlled by a motion sensor. The physical conditions of the harbor waters are also analyzed during the measurements, to precisely determine the speed at which the acoustic waves travel in the water.
A software collects the depth and position data that is then processed by the hydrographer. Since it is acoustic technology, it is necessary to screen data that correspond to the rebounds that can occur and propagate in the water, something that artificial intelligence is not always capable of distinguishing. “In terms of evolution, the algorithms that detect the bottom are becoming more efficient. The transducers, which are the parts that send the ultrasound, generate increasingly narrow beams,” explains Elisa Palacios, Hydrographer of the Port of Barcelona.
The Port of Barcelona is also working on autonomous unmanned vehicles to carry out bathymetries in inaccessible areas, such as construction sites and areas of complex navigability. Also, since 2018, work has been done on remote mixed solutions, where the hydrographer connects to the vessel from anywhere to control all the parameters of the bathymetric inspection, as if it were on board.
The collaboration between the Port of Barcelona and the most advanced ports in Europe is constant in this matter. Barcelona staff have been to Rotterdam or Hamburg studying the technical and operational processes of these ports, and vice versa.
Data management and visualization
Some European ports such as Hamburg and Rotterdam, which have their own hydrographic department, generate a wealth of information from bathymetries which are complemented by additional data collected by external organizations. All bathymetries are stored in a centralized database that is disseminated in various ways for users who need to access this information.
The data is managed using GIS software, a system that allows to collect, organize, administer, analyze, share and distribute geographic information that is also used by the Port of Barcelona. "The management, let's call it intelligent, of the data and its storage in a database together with the records that we can exploit is the most innovative, and follows what the main European ports do," explains Miguel Ángel Cañestro, Head of Geomatic Processes of the Port of Barcelona.
A series of metadata or additional information is added to the bathymetry data to enrich and update the 3D topographic model of the bottom, such as the type of sensor used, the vessel or area explored and the hydrographer in charge. These can then be cataloged by date, for example, where the most up-to-date data usually prevail.
The activity of the aforementioned ports, for example, requires practically continuous dredging work, so one of its main users is the Construction Department and its subcontracted companies, who receive digitized graphics with the latest depth data that is essential to identify the areas in which these works must be carried out.
“Much of this information was previously delivered on paper, but the trend points towards a digital format. In Barcelona, we are going to do it through a web portal where the information will be shared with internal clients, such as the infrastructure and maritime operations departments that can view it in 2D or 3D, depending on the level of detail they require,” shares Cañestro.
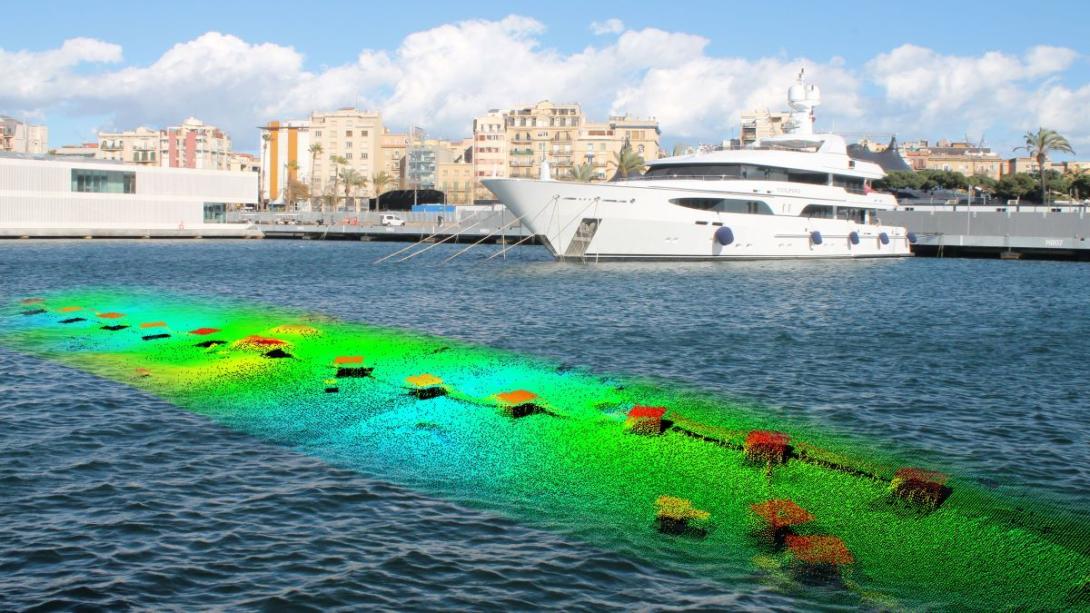
As well as the seabed, technological evolution is allowing to investigate the execution of bathymetries in vertical structures and water columns
The future doesn't stay in the seabed
This technological evolution has achieved such a level of detail that it is allowing hydrographers to go beyond mapping the bottom. Elisa Palacios announces that the next step is to make models of the walls of the docks and dikes. “The next evolution is to have the technology with such a level of resolution and precision that it will be allow to generate models of vertical structures, to analyze if the foundation piles of a bridge, for example, are suffering some kind of damage provoked by vessels which removes sediments near them," the hydrographer explains.
In this sense, Palacios shares that the developers of the multibeam data capture and editing software they use have requested the collaboration of her department to test the latest update of their program before releasing it to the market.
“The next thing we are going to do is acquire a new component for the multibeam system that will allow us to reach the water surface and have a model of the entire submerged part of the dock. This will be shared with the conservation department so that they can take the appropriate measures if repairs are needed,” she explains.
Another point of interest which is currently under research is the exploration of the water column and everything that causes a rebound of the acoustic signal to search for gas bubbles, fresh water emanations or floating elements which are dangerous for navigation. "We are very close to the mouth of the Llobregat, where a lot of organic matter has been deposited and generates gas later released, so this is something that must be controlled," says Palacios. The next revolution in port hydrography is just around the corner.